Design: Nodes size
By default, all the nodes have the same size.
It is possible to apply different sizes to nodes depending on their categories and/or property values. This makes it possible to differentiate nodes with a specific category and/or property.
There are two ways of applying a style for the size: Static and Dynamic:
Staticsizing works similarly to the coloring functionality of Linkurious Enterprise.Dynamicsizing allows the analyst to visualize the graph using a scaling function, which helps in immediately distinguishing important values.
For example, the following visualization represents 140 companies that received funding from Acme Corp VC firm. Which companies received the biggest funding? Hard to know by simply looking at this graph:
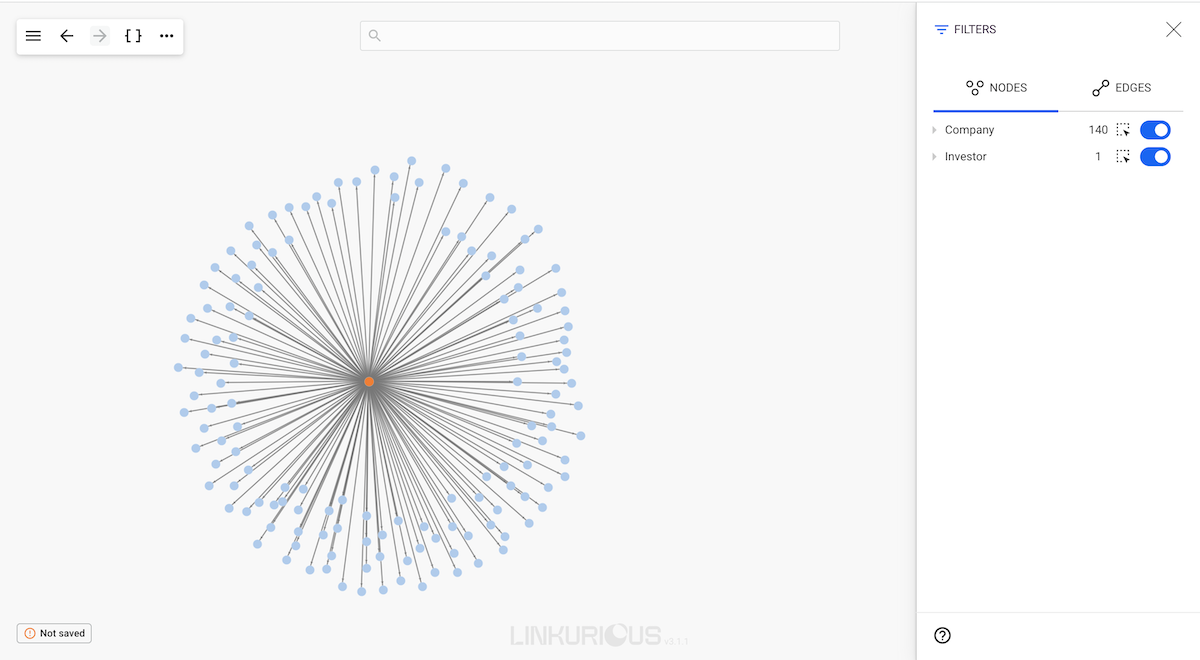
We are going to dynamically size the different companies according to their
funding_total property in order to visualize which ones are the most
successful. For that, let's use the Linear scale function.
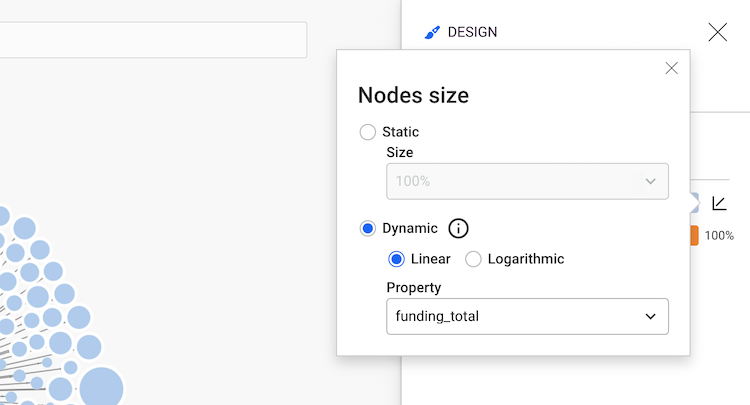
- Click the upper right corner to open the Design panel.
- Click the size icon next to the category
Company. - Choose
Linearoption then selectLogarithmic. - From the property list, select
funding_totalproperty.
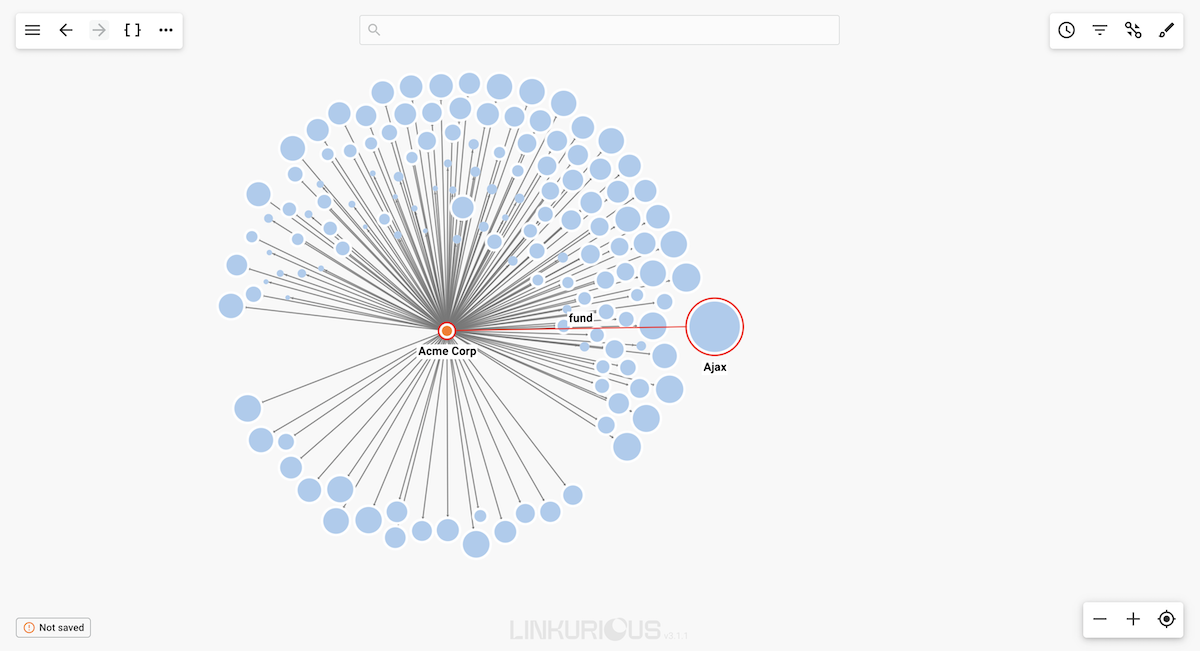
Now we can see that the size of the nodes with the category Company has changed – the larger the size of the node
is, the bigger the funding total value is.
We can quickly identify the most successful investment of investor "Acme Corp".