Getting started
What is Ogma?
Ogma is Linkurious's JavaScript graph visualization library. It provides a powerful graphics engine based on WebGL and supports older machines with HTML5 Canvas.
Ogma offers all features required to display, explore, and interact with graph data within Web applications. This includes connecting to various sources to import and export data, smart layouts of the data, rich user interaction, and fully customizable visual style.
Ogma is a commercial library. Please reach out to contact@linkurio.us to try it out.
Compatibility
Ogma runs on computers and tablets with the following browsers:
- Chrome >= 14
- Firefox >= 17
- Safari >= 6
- Edge >= 13 (experimental WebGL support since Edge 16)
- Internet Explorer >= 11 (with experimental WebGL support)
Please note that both Internet Explorer and Edge's support of WebGL is still experimental. Using a browser that does not fully support WebGL does not prevent you from using Ogma, however, performances drops are to be expected as the renderer might default back to canvas. For this reason, we recommend using Chrome.
Ogma also runs server-side in Node.js >= 4.4.0.
Installing the library
Ogma is available in two versions:
- ogma.min.js standard version
- ogma.dist.min.js contains Ogma and all optional dependencies
Client-side
Single HTML page
Download Ogma as ogma.zip archive from get.linkurio.us and extract it in your project folder.
In your HTML page point to the ogma.min.js file.
In single-page applications, Ogma can be imported as a script:
html
<!-- Import Ogma -->
<script src="path/to/ogma.min.js"></script>

<!-- Import Ogma and all optional dependencies-->
<script src="path/to/ogma.dist.min.js"></script>
Module loaders
Ogma is compatible with module loaders and advanced front-end javascript frameworks. Please refer to the tutorials for more information.
If you wish to use Ogma within an application that uses a module loader or a NodeJS environment, we suggest you adding it as a dependency to your project. This can be done in two ways:
Through npm
If you are developing locally and can access the outside Internet you can also install directly. sh npm install --save https://get.linkurio.us/api/download/npm?customerId={CUSTOMER_ID}&versionId={PACKAGE_ID}
If you cannot use npm from external sources, because of company policy, you can always install it via tar.gz.
Using downloaded tar.gz
The same link used for the npm version can be used to download a tar.gz file: just past it into your browser to download the file.
Once downloaded it is possible to tell npm to use it to install locally:
sh
npm install --save path/to/ogma-v.X.X.X.tar.gz
ES module
Ogma is compatible with the UMD format and can be used also with the new ES module format
import Ogma from 'ogma';Server-side
Ogma can be used in a Node.js server using the CommonJS convention:
// if you installed Ogma via npm CLI
var Ogma = require('ogma');

// of if you downloaded the js file manually
var Ogma = require('path/to/ogma.min.js);
Key concepts
An instance of Ogma is a javascript object that stores a graph internally and renders it in an HTML container according to styling rules.
Graph
A graph consists in entities (nodes) connected to each others by relationships (edges). Each node and edge embeds a data object that can be used to store custom properties.
Besides an API to manipulate the internal graph, Ogma offers convenient functions to generate random graphs, import graphs and connect to external data sources.
// Import a graph from a file and set it as ogma's internal graph.
ogma.parse.jsonFromUrl('data/myfile.json').then(function (rawGraph) {
  ogma.setGraph(rawGraph);

  // Retrieve the nodes from the 'Customer' category.
  // 'Category' is a property stored in the node's data object.
  var customers = ogma.getNodes().filter(function (node) {
    return node.getData('Category') === 'Customer';
  });

  // Print the customers's names to the console.
  // 'name' is a property stored in the node's data object.
  console.log(customers.getData('name').join());
});
HTML Container
An instance of Ogma is bound to an HTML container (generally, a
var ogma = new Ogma({
  container: 'graph-container'
});
is equivalent to:
var ogma = new Ogma();
ogma.setContainer('graph-container');
Styling
There are multiple ways to set the style of a graph, by decreasing priority:
- Nodes and edges can have a style property that is automatically applied when importing the graph (see the node and edge style formats).
- Styles defined via design rules automatically style nodes and edges.
- The style of specific nodes and edges can be overridden by manual styles that have priority over design rules.
Example:
// Add a node that has a style.
ogma.addNode({id: 'n0', attributes: {color: 'red', shape: 'circle'}});

// Create a rule that styles all nodes so they have a green color and a radius of 5.
ogma.styles.addNodeRule({
  color: 'green',
  radius: 5
});

// Create a rule that styles the nodes matching a **selector** (a predicate function) so they have a red color.
// Note that the radius fo those nodes is 5 as they also match the rule above.
ogma.styles.addNodeRule(function (node) {
  return node.getData('isValid') === true;
}, {
    color: 'red'
});

// Apply a manual style to the node 'n0'
ogma.getNode('n0').setStyle({color: 'purple'});Renderers
Ogma can use three different rendering technologies to display graphs:
- WebGL: most powerful (recommended for graphs over 2,000 nodes)
- HTML 5 Canvas: slower than WebGL but widely supported and better quality (recommended for graphs under 2,000 nodes)
- SVG: slower than Canvas.
By default, Ogma will use WebGL, and fallback on Canvas if not available. It is possible to specify the technology to use in the Ogma object constructor.
// Create an instance of Ogma that uses the 'canvas' render
var ogma = new Ogma({
  renderer: 'canvas',
  container: 'graph-container'
});

// Possible values for the `renderer` parameter are: 'webgl' (default), 'canvas' and 'svg'
Hello world!
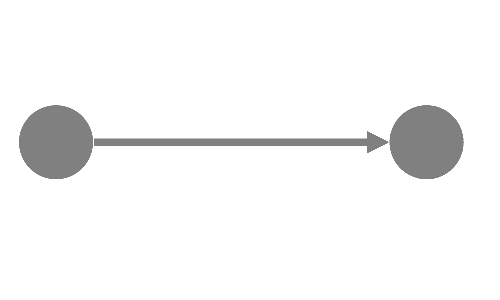
Let's start with a minimalist example that displays a graph with two nodes and a link between them.
<html>
<head>
  <!-- Include the library -->
  <script src="../build/ogma.min.js"></script>
  <style type="css">
  #graph-container { width: 500px; height: 500px; }
  </style>
</head>
<body>
  <!-- DOM element containing the graph -->
  <div id="graph-container"></div>

<script>
  // Create an instance of Ogma and bind it to the graph-container.
  var ogma = new Ogma({
    container: 'graph-container',
  });

  // Create a node with id 'n0'.
  var n0 = { id: 'n0', attributes: { x: 0, y: 0 }};
  // Add the node to ogma.
  ogma.addNode(n0);

  // Create a node with id 'n1'.
  var n1 = { id: 'n1', attributes: { x: 50, y: 0 }};
  // Add the node to ogma.
  ogma.addNode(n1);

  // Create an edge from 'n0' to 'n1'
  var e = {
    id: 'e0',
    source: 'n0',
    target: 'n1',
    attributes: {
      shape: 'arrow'
    }
  };
  // Add the edge to ogma.
  ogma.addEdge(e);
</script>
</body>
</html>
Result:
Loading data
Ogma internally stores a graph. Ogma can load data from any external data source as long as it is in the RawGraph format. For convenience, Ogma's parse module offers parsers for several formats, including standard graph formats (gexf) and JSON returned by the neo4j javascript driver.
Parsing is asynchronous: if you want to run code after the graph is parsed, such as to load the raw graph into Ogma, you must put it inside the Promise handler.
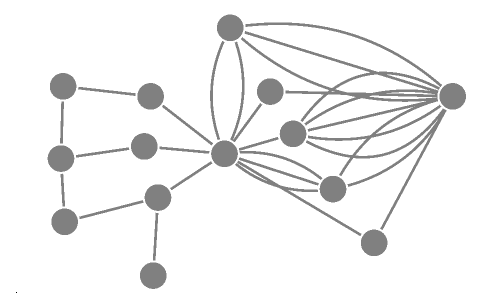
Let's load a JSON file available here then set it as Ogma's graph.
ogma.parse.jsonFromUrl('files/solarCity-nostyle.json').then(function (rawGraph) {
  ogma.setGraph(graph); // Clear Ogma's internal graph then add the raw graph to Ogma's internal graph

  // equivalent to:
  // ogma.clearGraph();
  // ogma.addGraph(graph);
});
Result:
Live examples:
Exports
With Ogma's export module, you can export the graph, its data, and create images in various formats.
Full graph exports
It is possible to export the full contents of the graph, including data and styles. Using the JSON and GEXF formats allow to load the file later with ogma.parse module.
Here, we export the graph to the JSON format.
ogma.export.json({
  pretty: true
}).then(function() {
  console.log('Graph exported.')
});
Live examples:
Data exports
Ogma's graph data can be exported to various formats.
For example, this line of code exports all nodes and their properties to the csv format.
ogma.export.csv({
    what: 'nodes' // use 'edges' to export the edges and their properties
});
The exports function can take several parameters into account in order to customize what should be exported.
In this example, we export the nodes and only some of their properties to the csv format. We also choose not to download the file but instead add a callback that displays the csv result into the console.
ogma.export.csv({
  what: 'nodes',
  dataProperties: ['name', 'address'],
  download: true
}).then(
function(csv) {
  console.log(csv);
});
Live examples:
Image exports
The graph can also be exported as an image in various formats.
Let's export the graph on the screen as a PNG file named 'screenshot.png'.
ogma.export.png({
  filename: 'screenshot.png'
});
Live examples:
Working with graph data
Ogma exposes an API to access and modify its internal graph. Those functions use nodes and edges in the Node, Edge, NodeList and EdgeList formats.
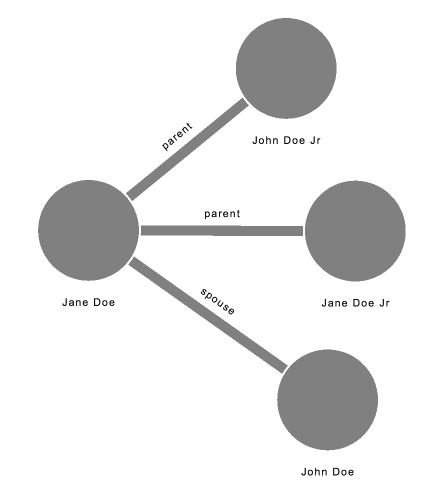
Creating nodes and edges
Let's add some nodes and edges to the graph. Note that nodes have to be added before edges. When adding or deleting many nodes or edges (more than 1,000) it is more performant to use the batch functions (e.g. ogma.addNodes()) than their individual counterparts (e.g. ogma.addNode()).
// Manually create nodes
ogma.addNodes([
  {id: 'john', data: {name: 'John Doe', age: 55}},
  {id: 'jane', data: {name: 'Jane Doe', age: 55}},
  {id: 'john_jr', data: {name: 'John Doe Jr', age: 15}},
  {id: 'jane_jr', data: {name: 'Jane Doe Jr', age: 18}},
]);

ogma.addEdges([
  {id: 'e1', source: 'john_jr', target: 'jane', data: {name:'parent'}},
  {id: 'e2', source: 'jane_jr', target: 'jane', data: {name:'parent'}},
  {id: 'e3', source: 'john', target: 'jane', data: {name:'spouse'}},
]);
Accessing nodes and edges
The functions ogma.getNode() and ogma.getNodes() (resp. ogma.getEdge() and ogma.getEdges()) retrieve nodes (resp. edges) from Ogma's internal graph. These functions can be chained to traverse the graph and collect the nodes that match certain criteria.
// Get node by id.
// nJohnJr is a Node object.
var nodeJohnJr = ogma.getNode('john_jr');

// Get nodes by id.
// parents is a NodeList object.
var parents = ogma.getNode(['john', 'jane']);

// Get all edges
// addEdges is an EdgeList object.
var addEdges = ogma.getEdges();

// Get the children of Jane
var neighbors = ogma.getNode('jane')
  .getAdjacentEdges()
  .filter(function(edge) {
    return edge.getData('name') === 'parent';
  })
  .getSource();
Custom data
Edges and nodes can also store custom data (in the data property). Custom data can be retrieved with the function ogma.getData(propertyName)available for Node, Edge, NodeList and EdgeList objects.
Let's retrieve the nodes that match a specific condition, then print their names to the console.
// Store all nodes with an age property above 50 in an NodeList object.
var youngsters = ogma.getNodes().filter(function(node) {
    return node.getData('age') > 50;
});

console.log(youngsters.getData('name').join(', '));
Visual styles
Let's now style the visualization. In the rest of this section, we illustrate how the style of nodes and edges can be changed.
- Rules are set globally with the functions ogma.addNodeRule() (resp. ogma.addEdgeRule()). Rules are functions use a criteria to select which nodes (resp. edges) they apply to. Rules are automatically updated when the nodes (resp. edges) they apply to change.
- Individual styles can be directly applied on specific Node, Edge, NodeList and EdgeList with the
setStyle()function.
In both cases, the NodeStyle (resp. EdgeStyle) objects are modified.
See a live example:
Texts
Nodes and edges usually have a text displayed under them. This text can be fixed or based on a custom property.
In this example, we create two rules. The first rule states that the text 'this is a link' should be used for every edge. The second rule states that the custom property 'name' of each node should be used as the node text.
// Assign a static text 'This is a link' to all edges
ogma.styles.addEdgeRule({
  text: 'This is a link'
});

// Bind the label of nodes to the value of their custom property 'name'
ogma.styles.addNodeRule({
  text: function (node) {
    return node.getData('name');
  }
});
Map rules
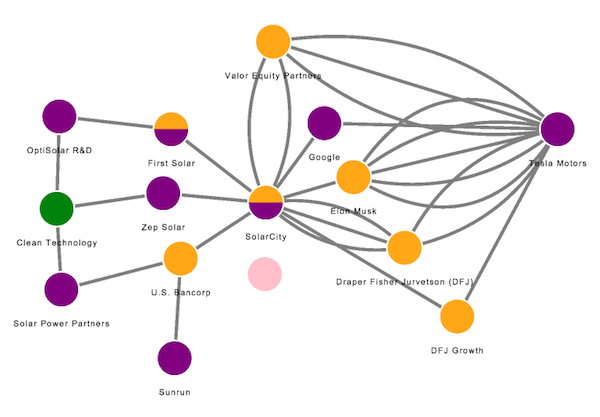
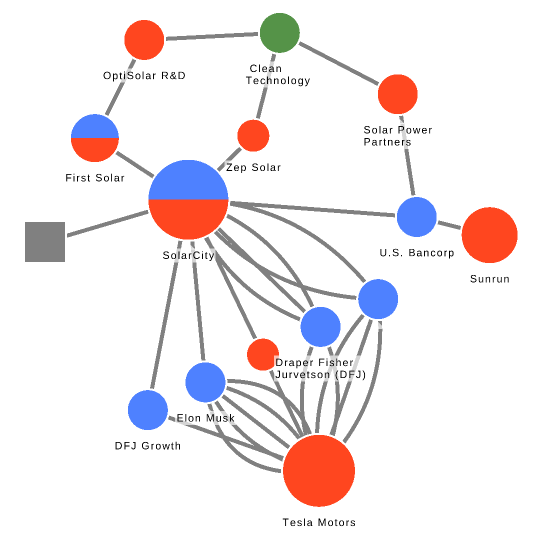
Map rules provide a convenient way to style nodes and edges based on qualitative properties (such as properties that represent categories):
The field parameter maps the data to the visual attribute.
If a value is missing, the visual attribute will be assigned the value in fallback if provided.
If the property mapped is an array and the style to change is the color, the node will be split into several colors like a pie chart. For other visual attributes (e.g. shape, icon, image), the first value of the array is picked.
For example, this code changes the color of nodes depending on their value for a custom property categories:
ogma.styles.addNodeRule({
  color: ogma.rules.map({
    field: 'categories',
    values: {
      'COMPANY': 'purple',
      'INVESTOR': 'orange',
      'MARKET': 'green',
    },
    fallback: 'pink'
  })
});
Slice Rules
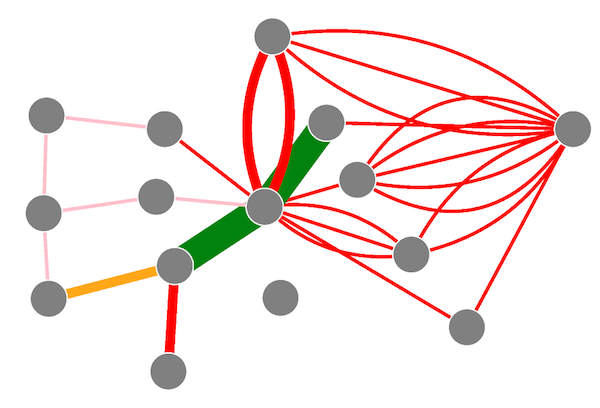
Slice rules can be used to map visual styles (e.g. color or size of nodes/edges) to quantitative properties (properties with numerical values).
For example, this code changes the width of edges depending on their value for a custom property properties.raised_amount_usd:
ogma.styles.addEdgeRule({
  width: ogma.rules.slices({
    field: 'properties.raised_amount_usd',
    values: {
      nbSlices:5,
      min: 1,
      max: 8
    },
    fallback: 1
  })
});
This rule changes the color of edges depending on their value for a custom property properties.raised_amount_usd:
ogma.styles.addEdgeRule({
  color: ogma.rules.slices({
    field: 'properties.raised_amount_usd',
    values: ['red', 'orange','green'],
    fallback: 'pink'
  })
});
Camera
The view has three components: position, zoom, angle. Here is a short overview of the view API:
// Move the view
ogma.view.move({x: 200, y: 400}, {duration: 2000});
// Double the level of zoom over 400 ms
ogma.view.zoomIn({zoomModifier: 2, duration: 400});
// Rotate the view by 90 degrees over 1 second
ogma.view.rotate(Math.PI / 2, {duration: 1000});
The function ogma.view.locateGraph() centers the view and sets the zoom level so the graph is visible. The function Node.locate() (resp. NodeList.locate()) centers the view on a given node (resp. given set of nodes). Similar functions exist for edges.
// Adjust the view so the full graph is displayed on the screen.
ogma.view.locateGraph();

// Center the view on the node with id 'n0'.
ogma.getNode('n0').locate();

// Center the view on the node with id 'n0' and its neighboors.
ogma.getNode('n0').getAdjacentNodes().locate();
Layouts
Layout algorithms position the nodes of the graph to reveal structural patterns.
For example, the ForceLink layout makes connected nodes attract each others, and disconnected nodes repulse each other.
This example runs the ForceLink layout with a nodeSiblingsScale factor of 12,
and animate the positioning of nodes over 400ms, then center the camera with an animation over 300ms.
ogma.layouts.forceLink({
  nodeSiblingsScale: 12,
  duration: 400
}).then(function () {
  console.log('Layout done.');
});- The first argument is the parameters of the layout.
- The method returns a Promise.
You can find the list of available layouts and their parameter in the Layouts module.
Important note
The layout is asynchronous, so if you want to run code after the layout is done,
you must put it inside the Promise handler or in the onEnd parameter.
See more live examples:
Filters
Filters
Filters can be defined globally to filter nodes and edges out of the visualisation. They use a function selector that returns a boolean indicating whether the node or the edge should be visible (true) or filtered out (false). Filters are automatically applied to new nodes and edges or when their data is updated.
The following example only shows nodes having a data.properties.funding_total
property greater than 300 million.
// Create a filter on nodes.
var filter1 = ogma.addNodeFilter(function (node) {
  return node.getData('properties.funding_total') > 300000000;
});

// Removed the node filter.
ogma.removeNodeFilter(filter1);

// Remove all node filters.
ogma.clearNodeFilters();
Interactions
To enable user interaction with the graph and connect to the rest of the interface, Ogma uses a set of events.
Events and Interaction
Ogma can handle various mouse, touch and keyboard events, and emits events when its internal graph data changes.
// Display the id of the node under the cursor when the user clicks or taps on it:
ogma.events.onNodeClick(function (evt) {
  console.log('Node ' + evt.node.getId() + ' was clicked at (' + evt.x + ', ' + evt.y + ')');
});

// Open/close the geographical mode when the user presses Ctrl + M on the keyboard.
ogma.events.onKeyPress('ctrl m', function (evt) {
  ogma.geo.toggle();
});

// Log a message in the console when a node is added
ogma.events.onNodesAdded(function (evt) {
  console.log('Nodes added with ids: [' + evt.nodes.getId().join(', ') + ']')
});
More live examples
Selection
Users can select nodes and edges with the mouse, touch or with tools (lasso or rectangular selection). Ogma implements a standard selection mechanism with the followind default behavior:
- A node/edge is selected when clicked.
- The selection is cleared when the background is clicked.
- A node/edge is added to the selection when clicked and the 'ctrl' key is held and the node/edge is not in the selection.
- A node/edge is removed from the selection when clicked and the 'ctrl' key is held and the node/edge is already in the selection.
The current selection can be retrieved as NodeList and EdgeList.
// Log the list of nodes in the selection
var currentSelection = ogma.getSelectedNodes();
console.log(currentSelection.getId().join(', '));
Here is a full example to demonstrate this feature and how to interact with it.
Lasso selection
Ogma has a lasso mode to create custom selections by drawing with the mouse: see the lasso example.
Rectangular selection
In the same spirit as the lasso mode, ogma offers a rectangular selection mode to facilitate zone selections.
Contact
Don't hesitate to reach out, we'd be glad to hear what you think and answer any question you may have.
- For commercial inquiry: contact@linkurio.us
- For technical help and bug report: support@linkurio.us